In order to determine whether you are making quantifiable improvements across your music marketing campaigns, you need a starting point, also known as a benchmark. This feature from Wavo makes benchmarking easy, combining any set of marketing campaigns into a single, aggregate view.
From average cost per action to budget breakdowns by platform, this dashboard will surface the benchmarks you need to establish appropriate targets and standards for your campaigns. All in seconds without moving any data yourself.
Let's take a closer look at the dashboard!
1. Aggregated Marketing Results
Data is a marketer’s most valuable asset, but is often siloed across platforms, making it difficult to evaluate all of your team’s activities and improve.
With a few clicks, organize all of your campaign data into a single, aggregate view including data snapshots and trends. Monitor your digital marketing KPIs and determine whether more budget or budget allocations are needed to hit your goals.
Feature Highlight: Scorecard Benchmarks
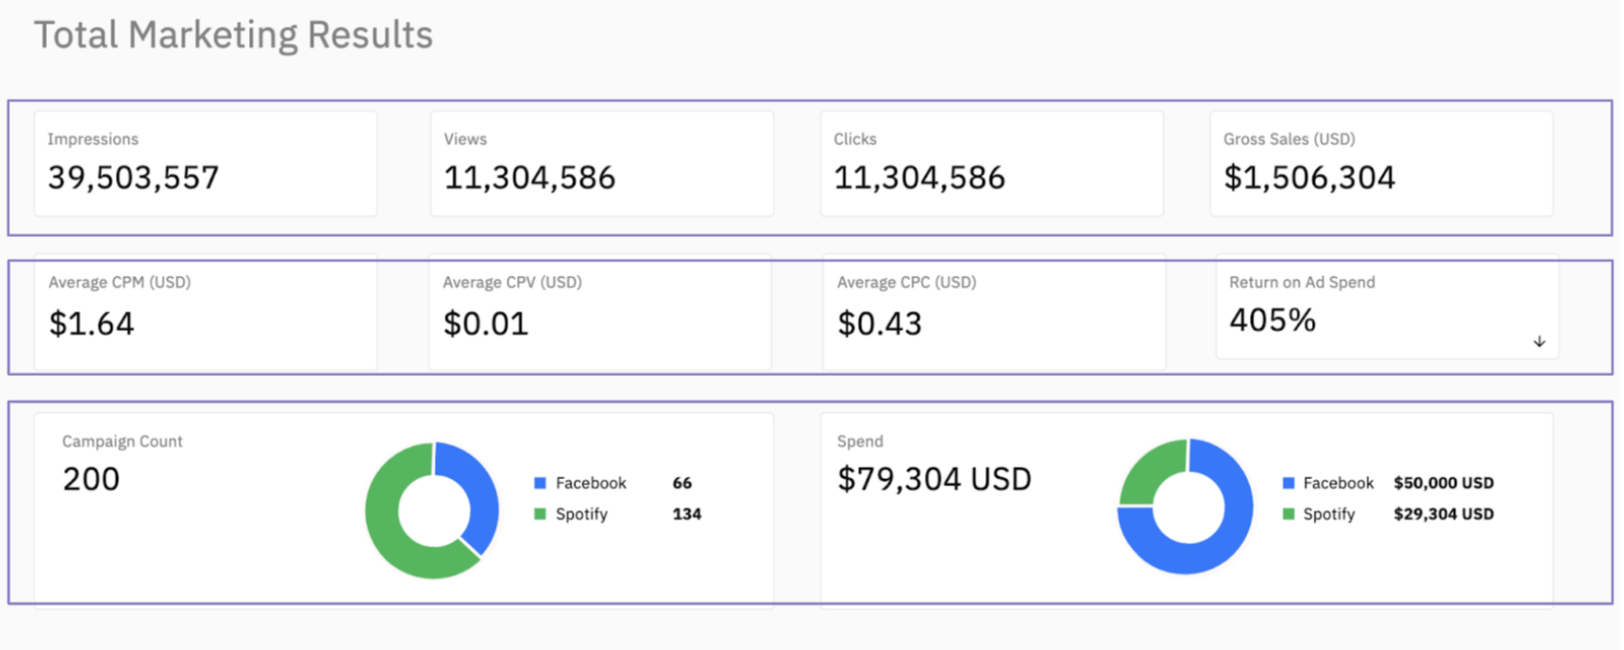
The scorecard benchmark allows you to easily analyze total results, average costs, as well as total campaign count and spend over a selected time period.
Feature Highlight: Time Series Benchmark
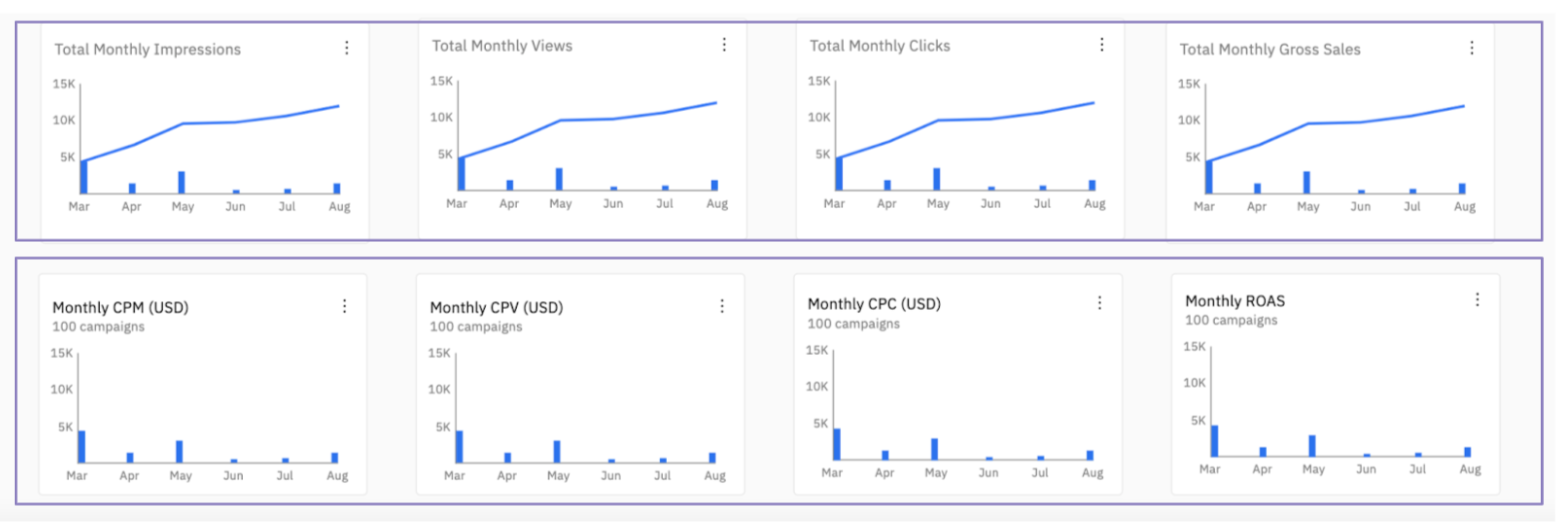
Get an in-depth look of total results and average costs over time with the time series benchmark graphs. A clean overview of your aggregated data to help visualize trends across performance metrics and spend.
Why is this important? Data on its own doesn’t tell us much. By aggregating your data together, it becomes possible to surface benchmarks that provide context for past performance and future campaigns. Review them often to see your improvements and the impact your strategy is having.
2. Highlight Important Metrics
Quickly pull up platform-specific KPIs and review their performance over time. You can slice the data by artist, currency, and ad type by default. Filter the data even further by creating custom tags based on your business needs.
Feature Highlight: KPIs
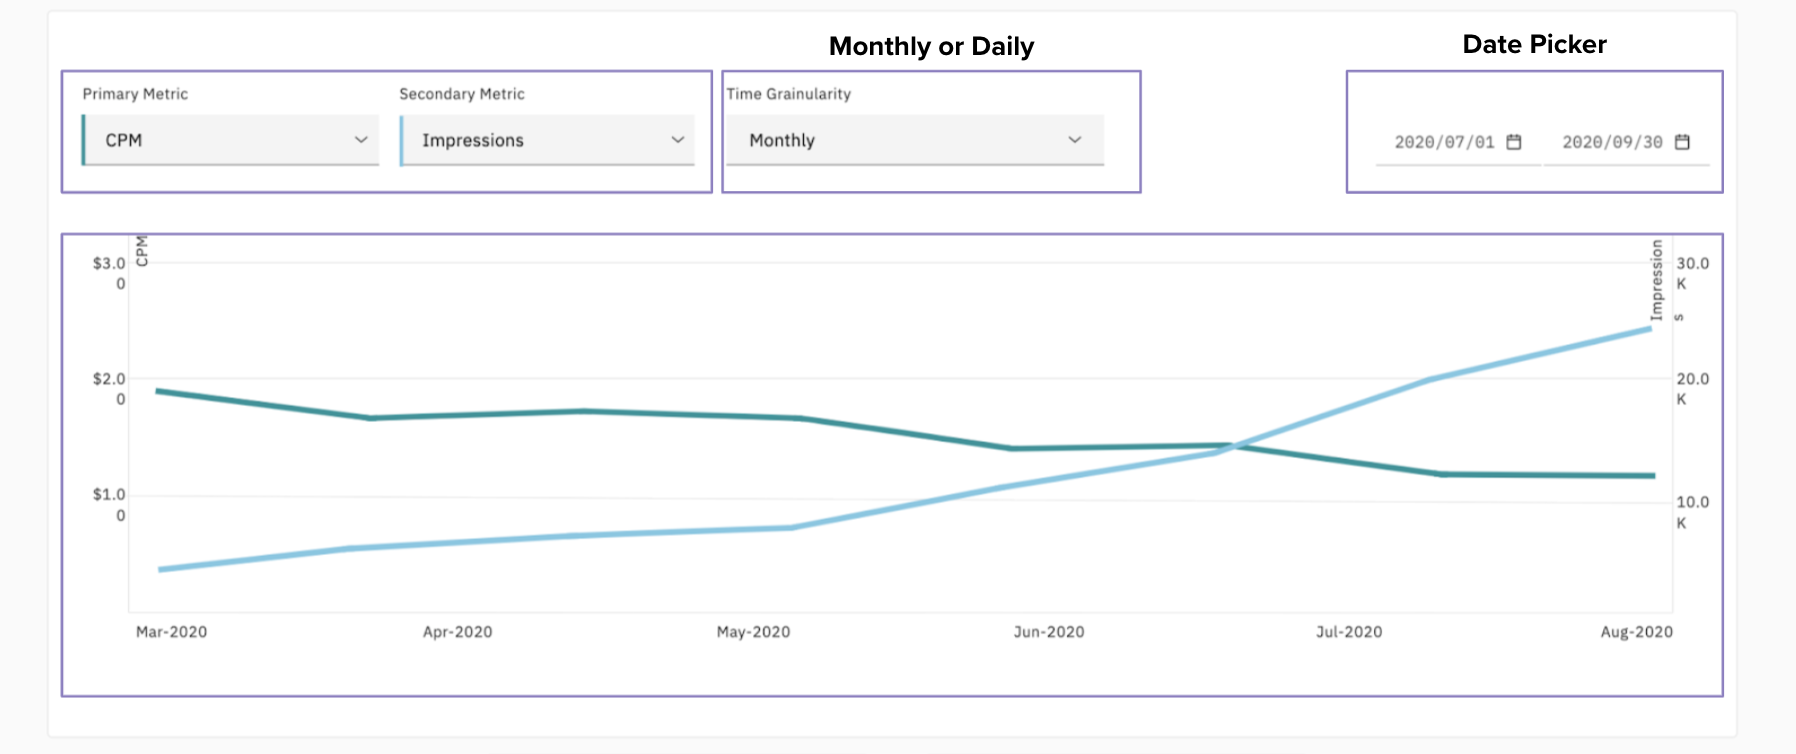
Easily compare primary and secondary metrics with the KPI chart. Adjust time granularity to a monthly or daily level, in addition to customizing date range. The integrated time series chart allows for easy visualization of your metrics over time.
Filters
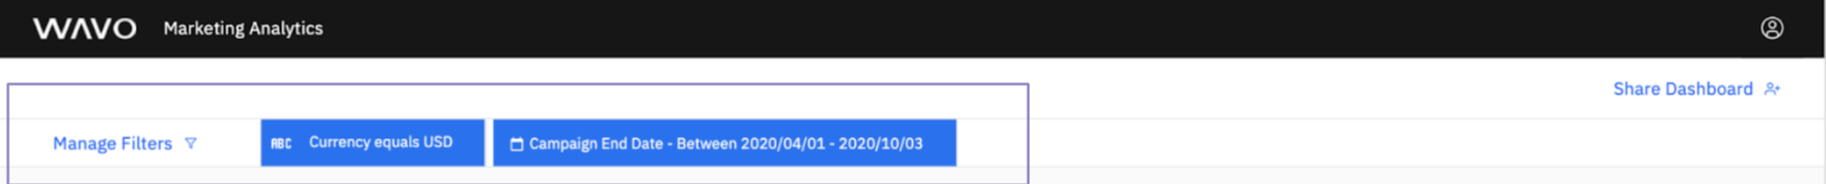
Further refine your data with the use of date and metric filters. Filter by artist name, platform, and currency, as well as additional filters which are automatically added based on tagging.
Why is this important? Get answers to questions like “How much should I spend on marketing in North America this quarter?” or “Is this a good click-through rate for Pop?” Come prepared to meetings with the data you need to objectively assess marketing performance and unlock new budgets.
3. Collaborate from the Same Data Foundation
Wavo’s Digital Marketing Benchmark Dashboard removes silos among marketing teams responsible for media planning and reporting, and provides leadership with a unified view of investments:
- Marketing Associates / Product Managers get a frame of reference to set goals, determine the budget required to achieve goals, and generate accurate reports.
- Managers / Directors / Executives see a global view of all marketing investments and performance in one place without the need for spreadsheets or additional calculations.
- Data Analytics allows for access to all of your data in a single place and provides answers to both common and complex marketing analytics questions.
Want to see the Wavo platform in action? Request to book a demo with one of our experts. Book a Demo.