Artists generate huge amounts of data: on Spotify alone, more than 60,000 songs are uploaded every day.
Without a single solution to unify artist streaming metrics and measure the ROI of streaming campaigns, marketing teams pull data from wherever they can get it, and end up making decisions based on inconsistent and incomplete numbers.
By ingesting all your first-party streaming data in a single place, you can get a complete picture of streaming performance, tie marketing to streaming numbers, and make informed decisions based on data.
With Wavo, you can measure your impact on streaming growth in minutes by building your own dashboard to visualize your data. Let's take a deeper dive into the feature!
1. Ingest and visualize all your streaming data in a single platform
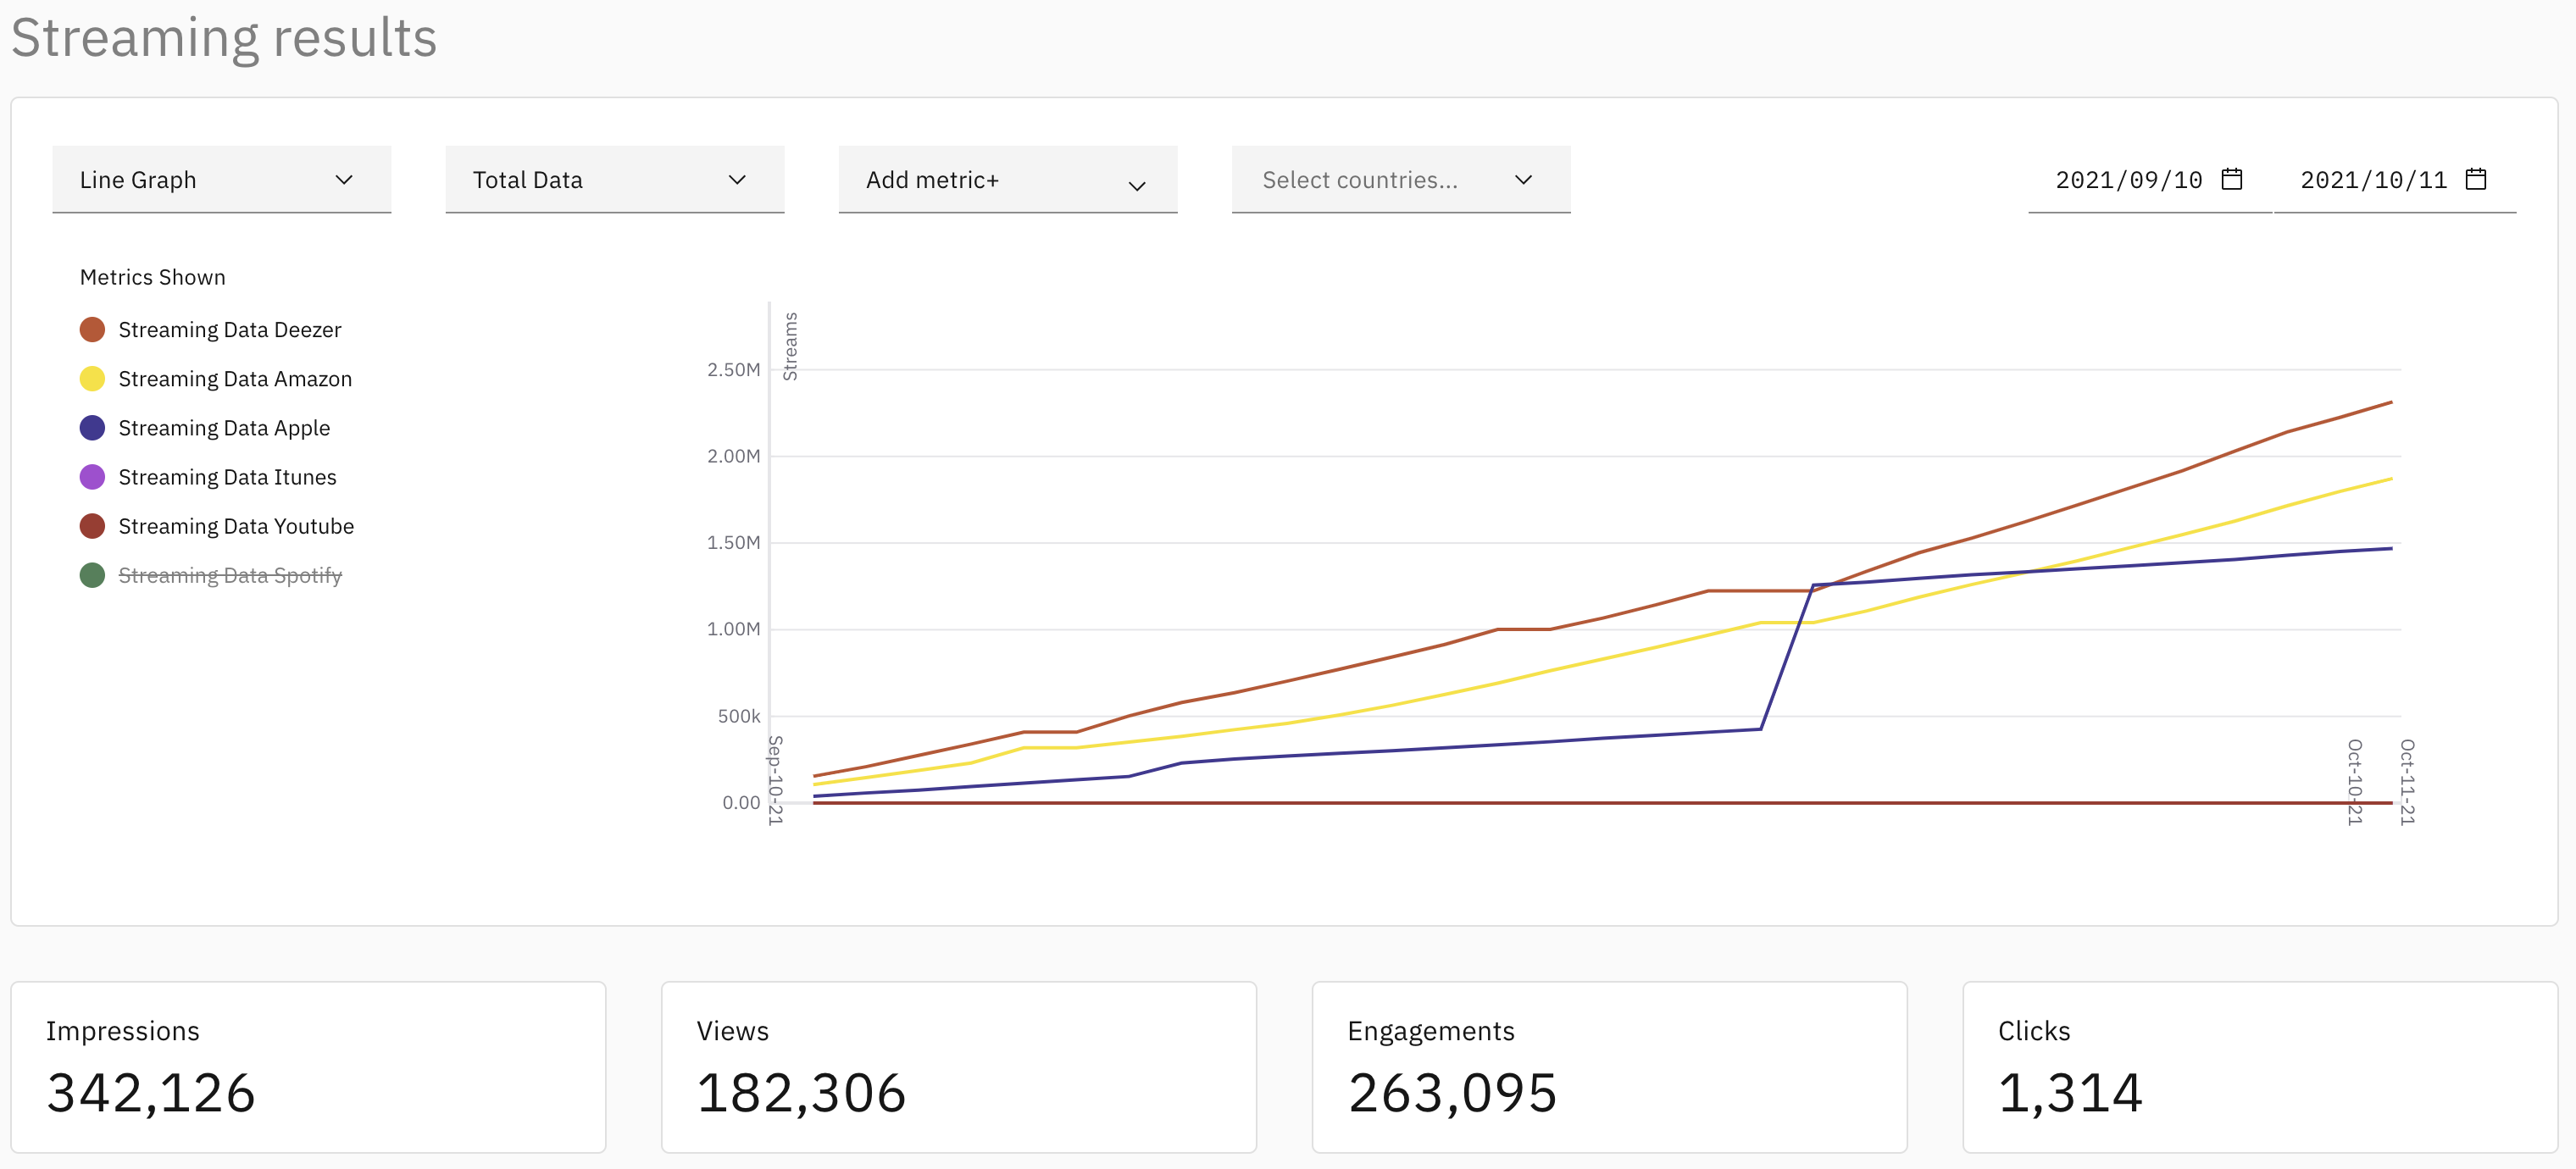
- Ingest all of your first-party streaming data and visualize individual releases within related marketing campaign dashboards using ISRC codes. Enable data-driven decision-making for your streaming and marketing teams.
- View your data as a total view, or daily views to better understand how your streams are progressing.
- Customize your date window using the incorporated date selector tool, to analyze your streaming results for any specific timeframe of the release.
- Take a closer look at individual regions driving streams with the Country Filter.
- To add streaming data to a dashboard, simply ensure all relevant campaigns are tagged with the appropriate ISRC code.
- Read How Wavo uses ISRC Codes and Campaign Level Tagging in the Wavo Help Centre to learn more about using ISRC codes.
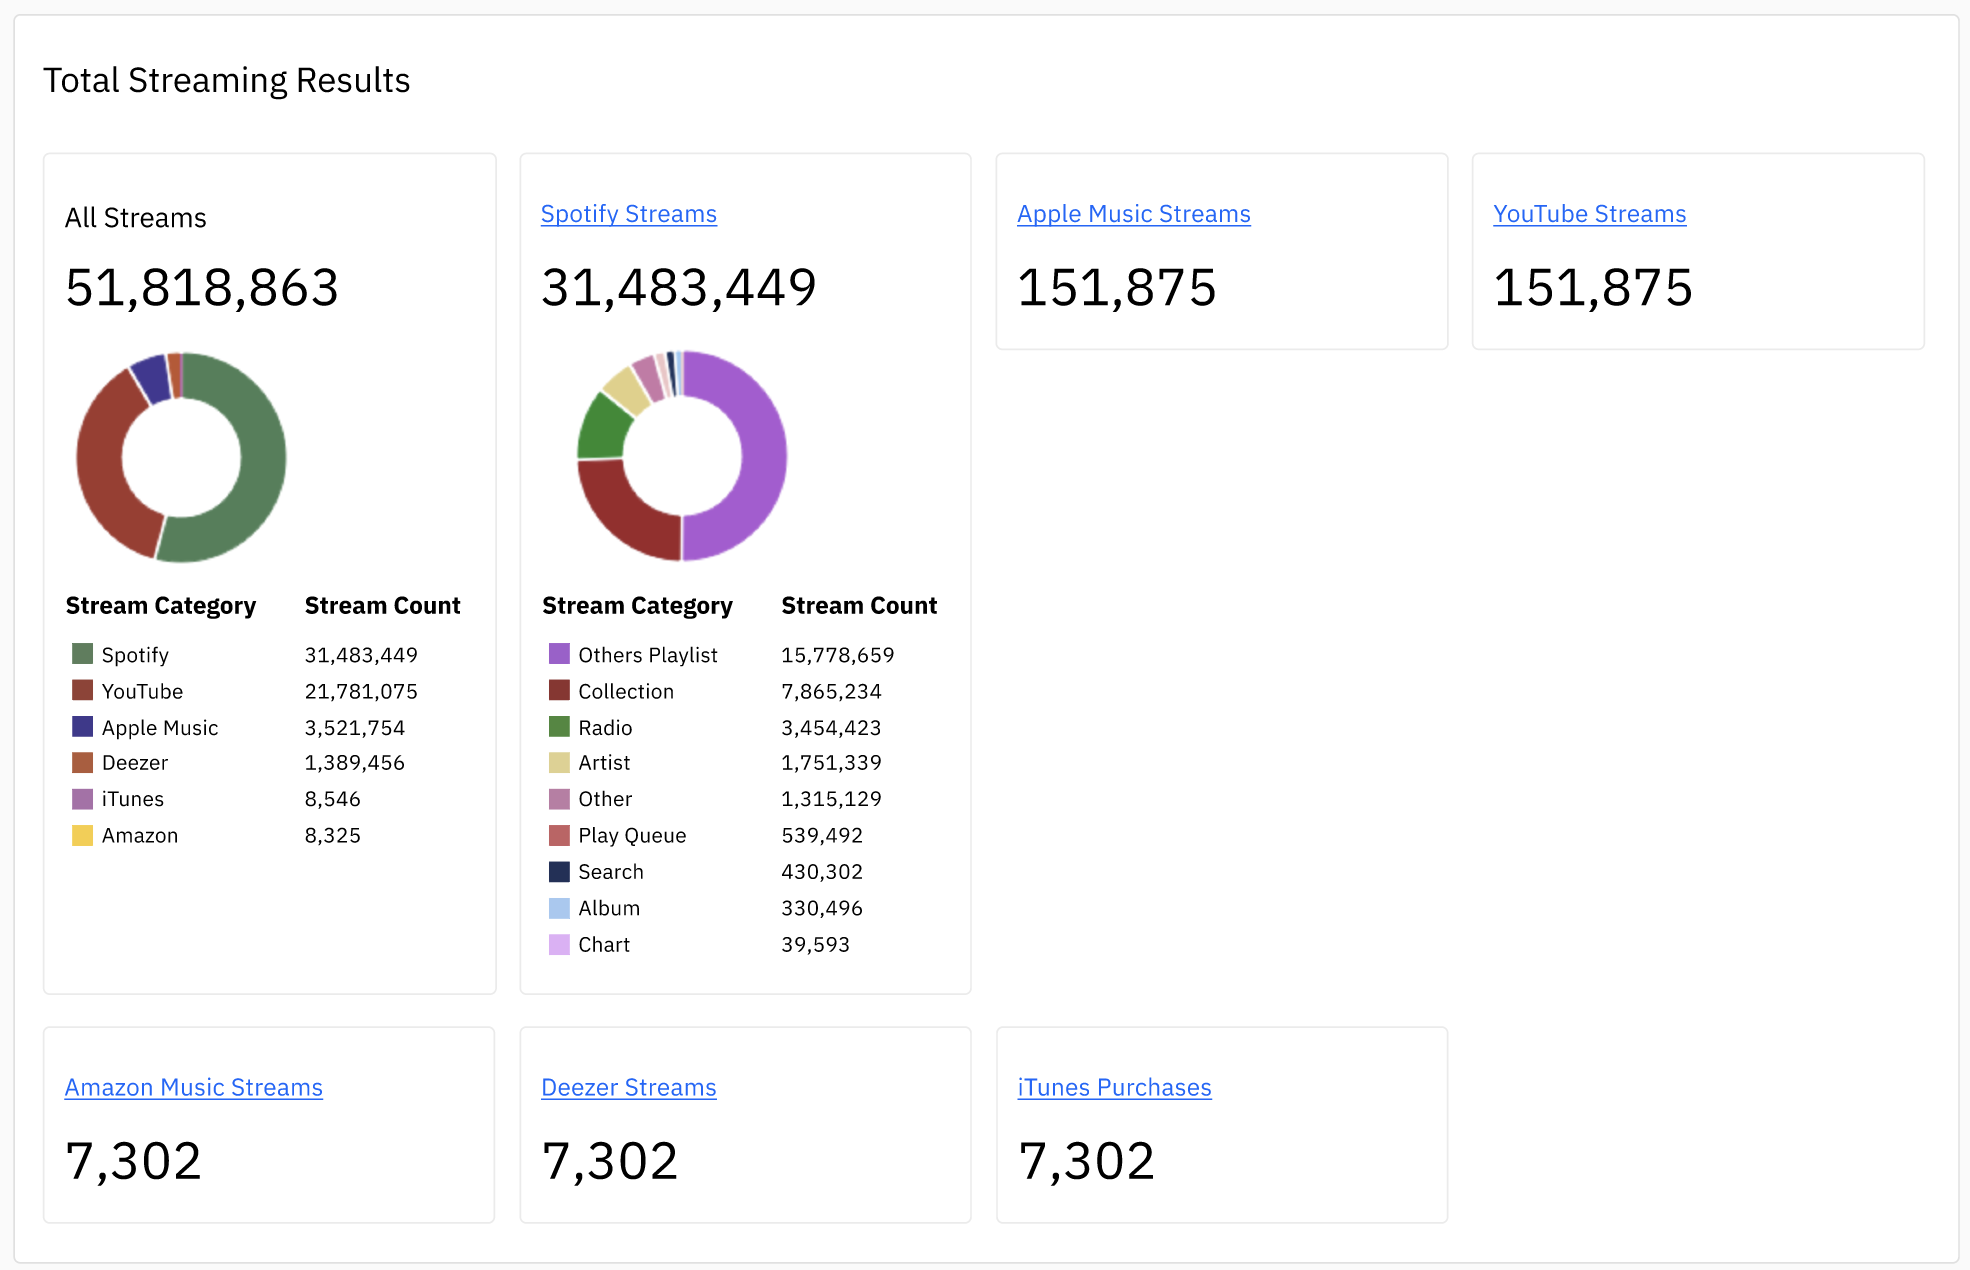
2. Understand which DSP drives the most streams
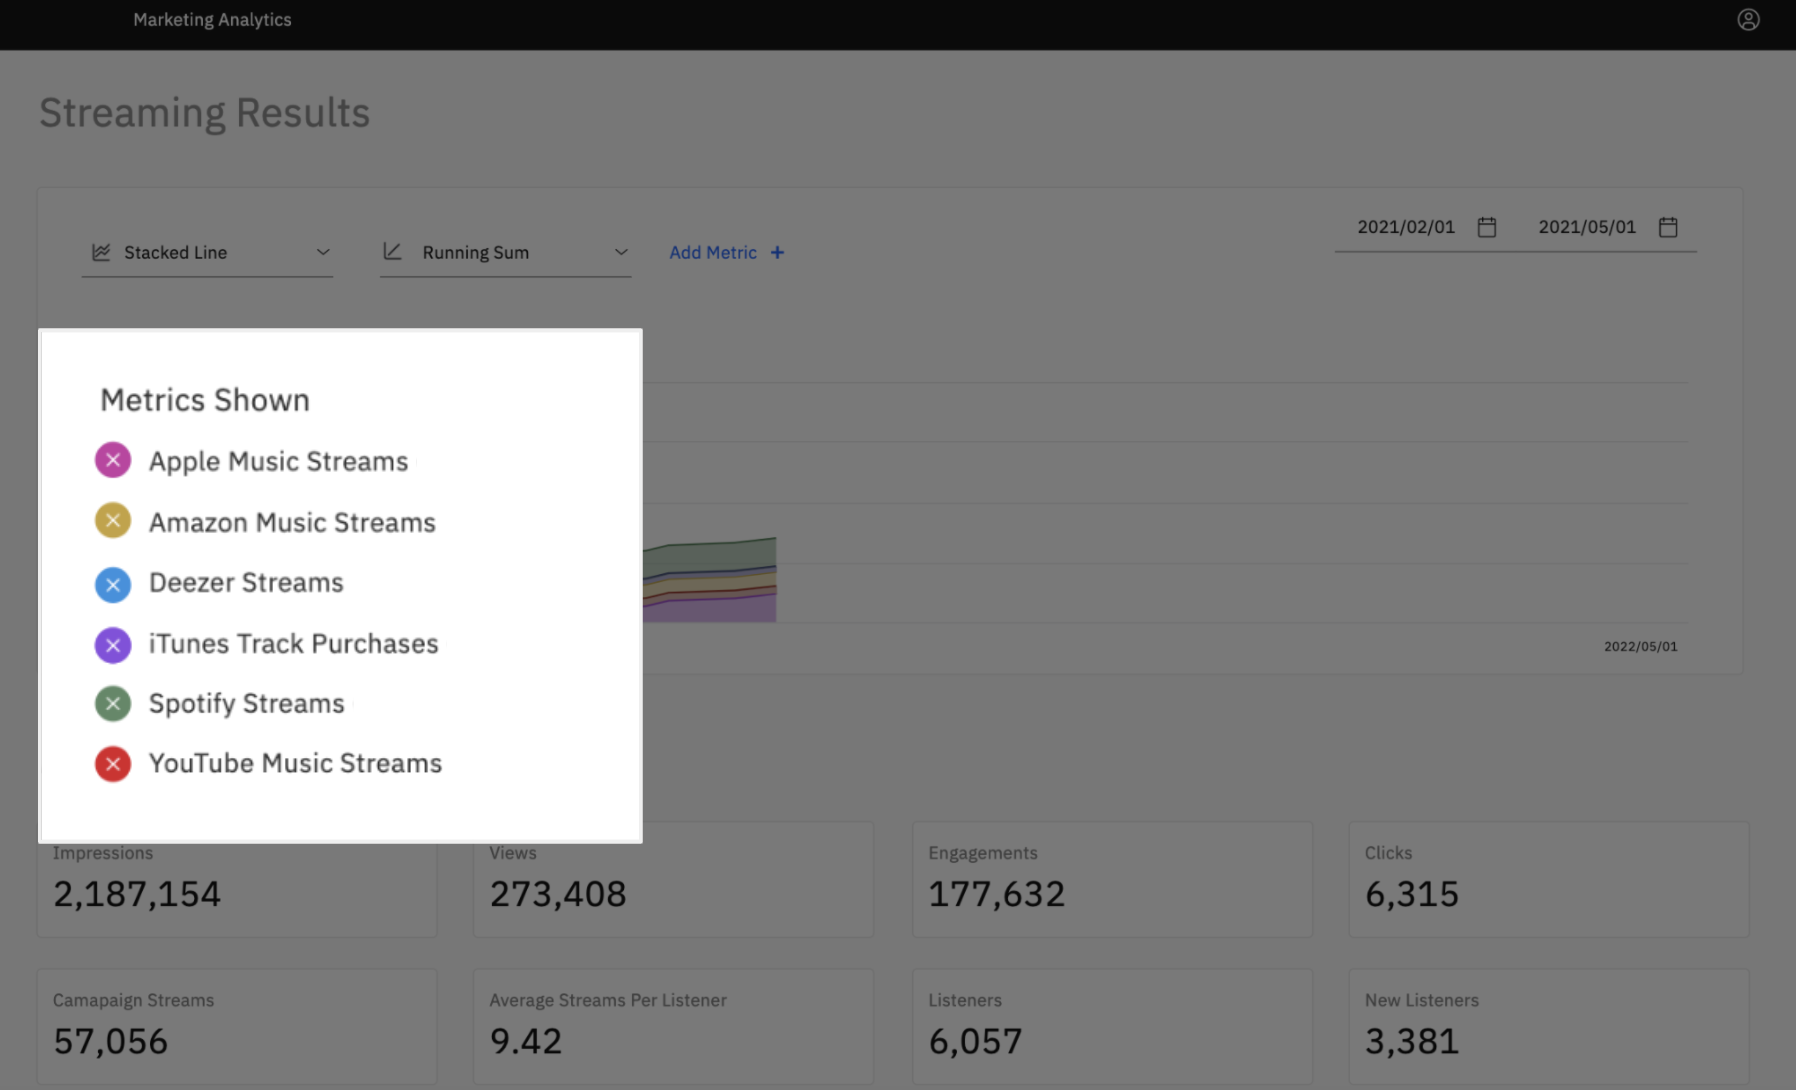
- See and understand which platform is driving the most streams without exporting any ad data. Isolate individual platforms for further analysis. Double down on the channels that perform best for your artists.
- To add/remove a DSP from the streaming visualization, simply select or deselect it from the Metrics Shown menu on the left hand side of the graph.
- Streaming Data Ingestion: DSPs including Amazon Music, Apple Music, Deezer, iTunes, Spotify, YouTube Music, and more.
3. Correlate marketing efforts with streaming performance
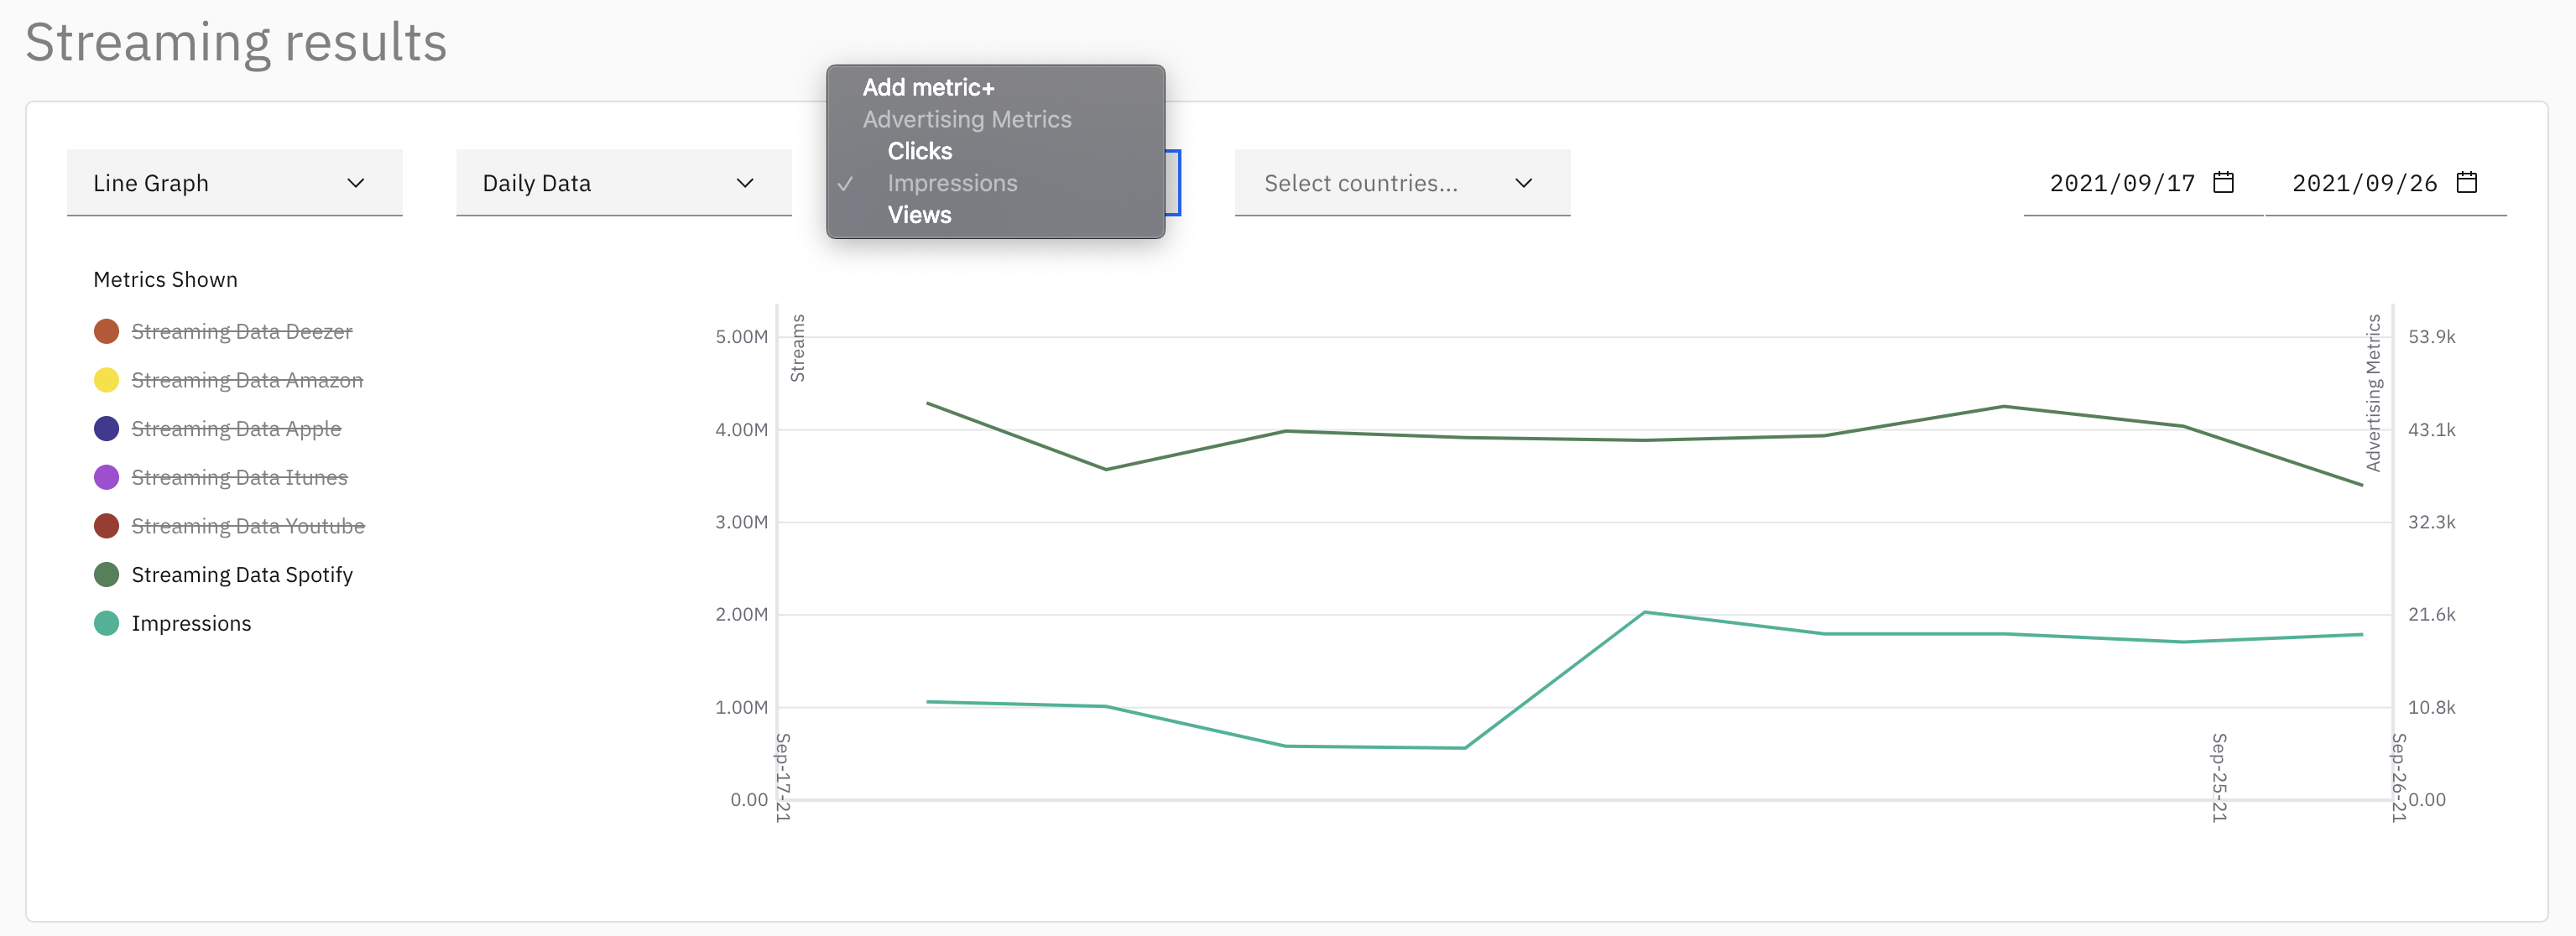
- Automate the process of associating streaming campaigns to sales revenue within a single report. Improve your visibility into marketing’s impact on steaming performance.
- Streaming & Marketing Results Chart: Overlay platform stream counts with Impressions, Video Views or Clicks from major ad platforms. Slice and these metrics to uncover trends and generate insights, know how one streaming platform compares to another, and how each platform contributes to the total streams for an artist's release.
4. Understand Audience Streaming Behaviour with Spotify Source Breakdowns
- Spotify source breakdowns provide helpful insight into both how new fans are discovering a release, and how existing fans currently stream it.
- Uncover whether a release is losing 'active' streaming momentum with listeners, and understand how to better allocate your promotional budgets for optimal streaming results.
- Dig deeper, and gain access to more granular correlations between digital marketing spend and streaming results to better understand if your efforts are driving awareness and delivering an increase in daily streams from Spotify searches by listeners.
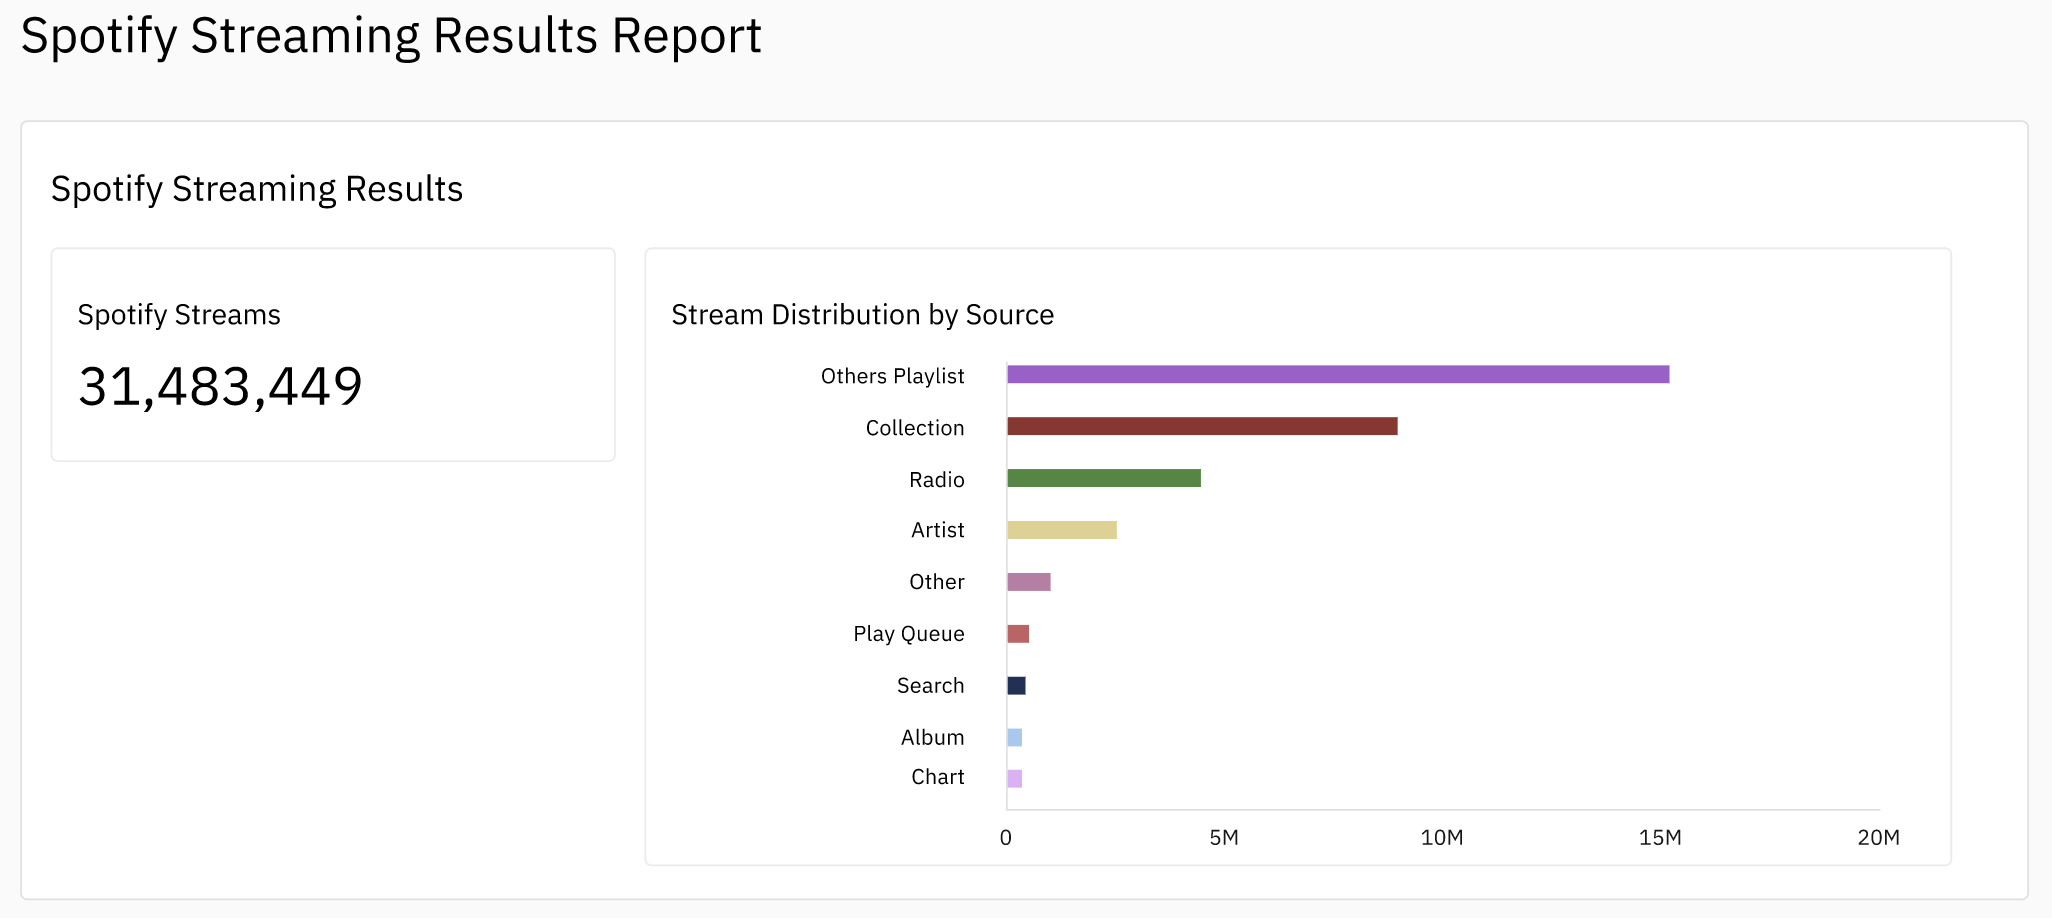
Below is a list of available Spotify Source breakdown categories and their definitions:
Others Playlist
- Spotify Editorial Playlists
- Other Listeners Playlists
- Listeners Own Playlists (Streaming a track from a personal playlist a user has created)
- Charting Playlists
Collection
- Listeners "Liked Songs" playlist (Saves)
Radio
-
Discover Weekly
-
Release Radar
-
Your Daily Mix
-
On Repeat and On Repeat Rewind
-
Spotify Radar
-
Streams from when a listener has reached the end of an album, playlist, or selection of tracks, and Spotify automatically plays this track for the user as a recommendation.
Artist
-
Streaming a track from an artist profile or song page after clicking on a smart link or third-party website link.
Other
- Streams from devices the listener has connected to through Spotify Connect, and from non-app sources such as embedded Spotify Play widgets found on an artist's website.
Play Queue
- Streams resulting from listeners selecting “Add to Queue”.
Search
-
Streams from in-app search, when the user immediately listens to the track via the search results.
Album
- Streaming a song when the user has started listening to the album that contains the track.
Chart
-
Streams from Spotify charting playlists including 'Top 50 Canada' or 'Top 50 Global'.
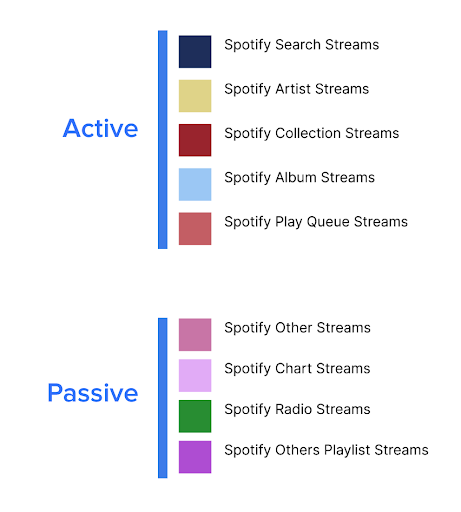
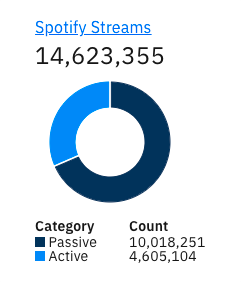
5. Understand The Listener's Level Of Intent With ‘Passive’ & ‘Active’ Streams On Spotify
- Wavo’s Marketing Analytics Dashboards allow marketers and streaming strategists to easily understand how intentional users are when listening to a song.
- ‘Passive’ and ‘Active’ Spotify streams on the Wavo Dashboards categorize the users streaming intent into 2 separate categories; allowing stakeholders to quickly understand how many streams are coming from users' actively streaming the track with deliberate listening.
- For reference, the definitions of both active and passive streams are listed below along with an infographic that further clarifies what can be accounted for within each bracket.
- Active streams come from listeners that proactively seek out the track/album, whether that be from searching for it on Spotify or listening to it from their saved library of music.
- Passive streams are from listeners that come across the track organically without searching for it. This occurs when the track is featured within an artist/track radio station, an algorithmic playlist, or a platform editorial.
Want to see the Wavo platform in action? Request to book a demo with one of our experts. Book a Demo.