You may have assumptions about how your marketing is having an impact on the streaming consumption of a release. While your intuition is likely on the right track, running an analysis to confirm your assumptions can be a difficult and timely process. Wavo’s new Streaming Correlation widget solves this problem.
This widget helps you understand what streaming platform your advertising correlates the strongest to in terms of driving streams and listener engagement. Leave the complicated math to Wavo Analytics so you can quickly make informed marketing decisions, and get back to focusing on promoting your artists.
How do I use it?
The new Streaming Correlation widgets can be found on the ‘Campaign Overview’, ‘Streaming Overview’, and Digital Streaming Platform-specific report pages.
The first thing to do is to consider where you think you may find correlations between advertising and streaming results. For example, if your campaign is looking to drive streams for a new release, then you will likely want to use the left navigation bar to navigate to the ‘Spotify Streaming Results’ report, due to Spotify having the greatest market share of all the streaming platforms. Conversely, if you are looking to drive music video views for the release, it will be best to navigate to the ‘YouTube Streaming Results’ page.
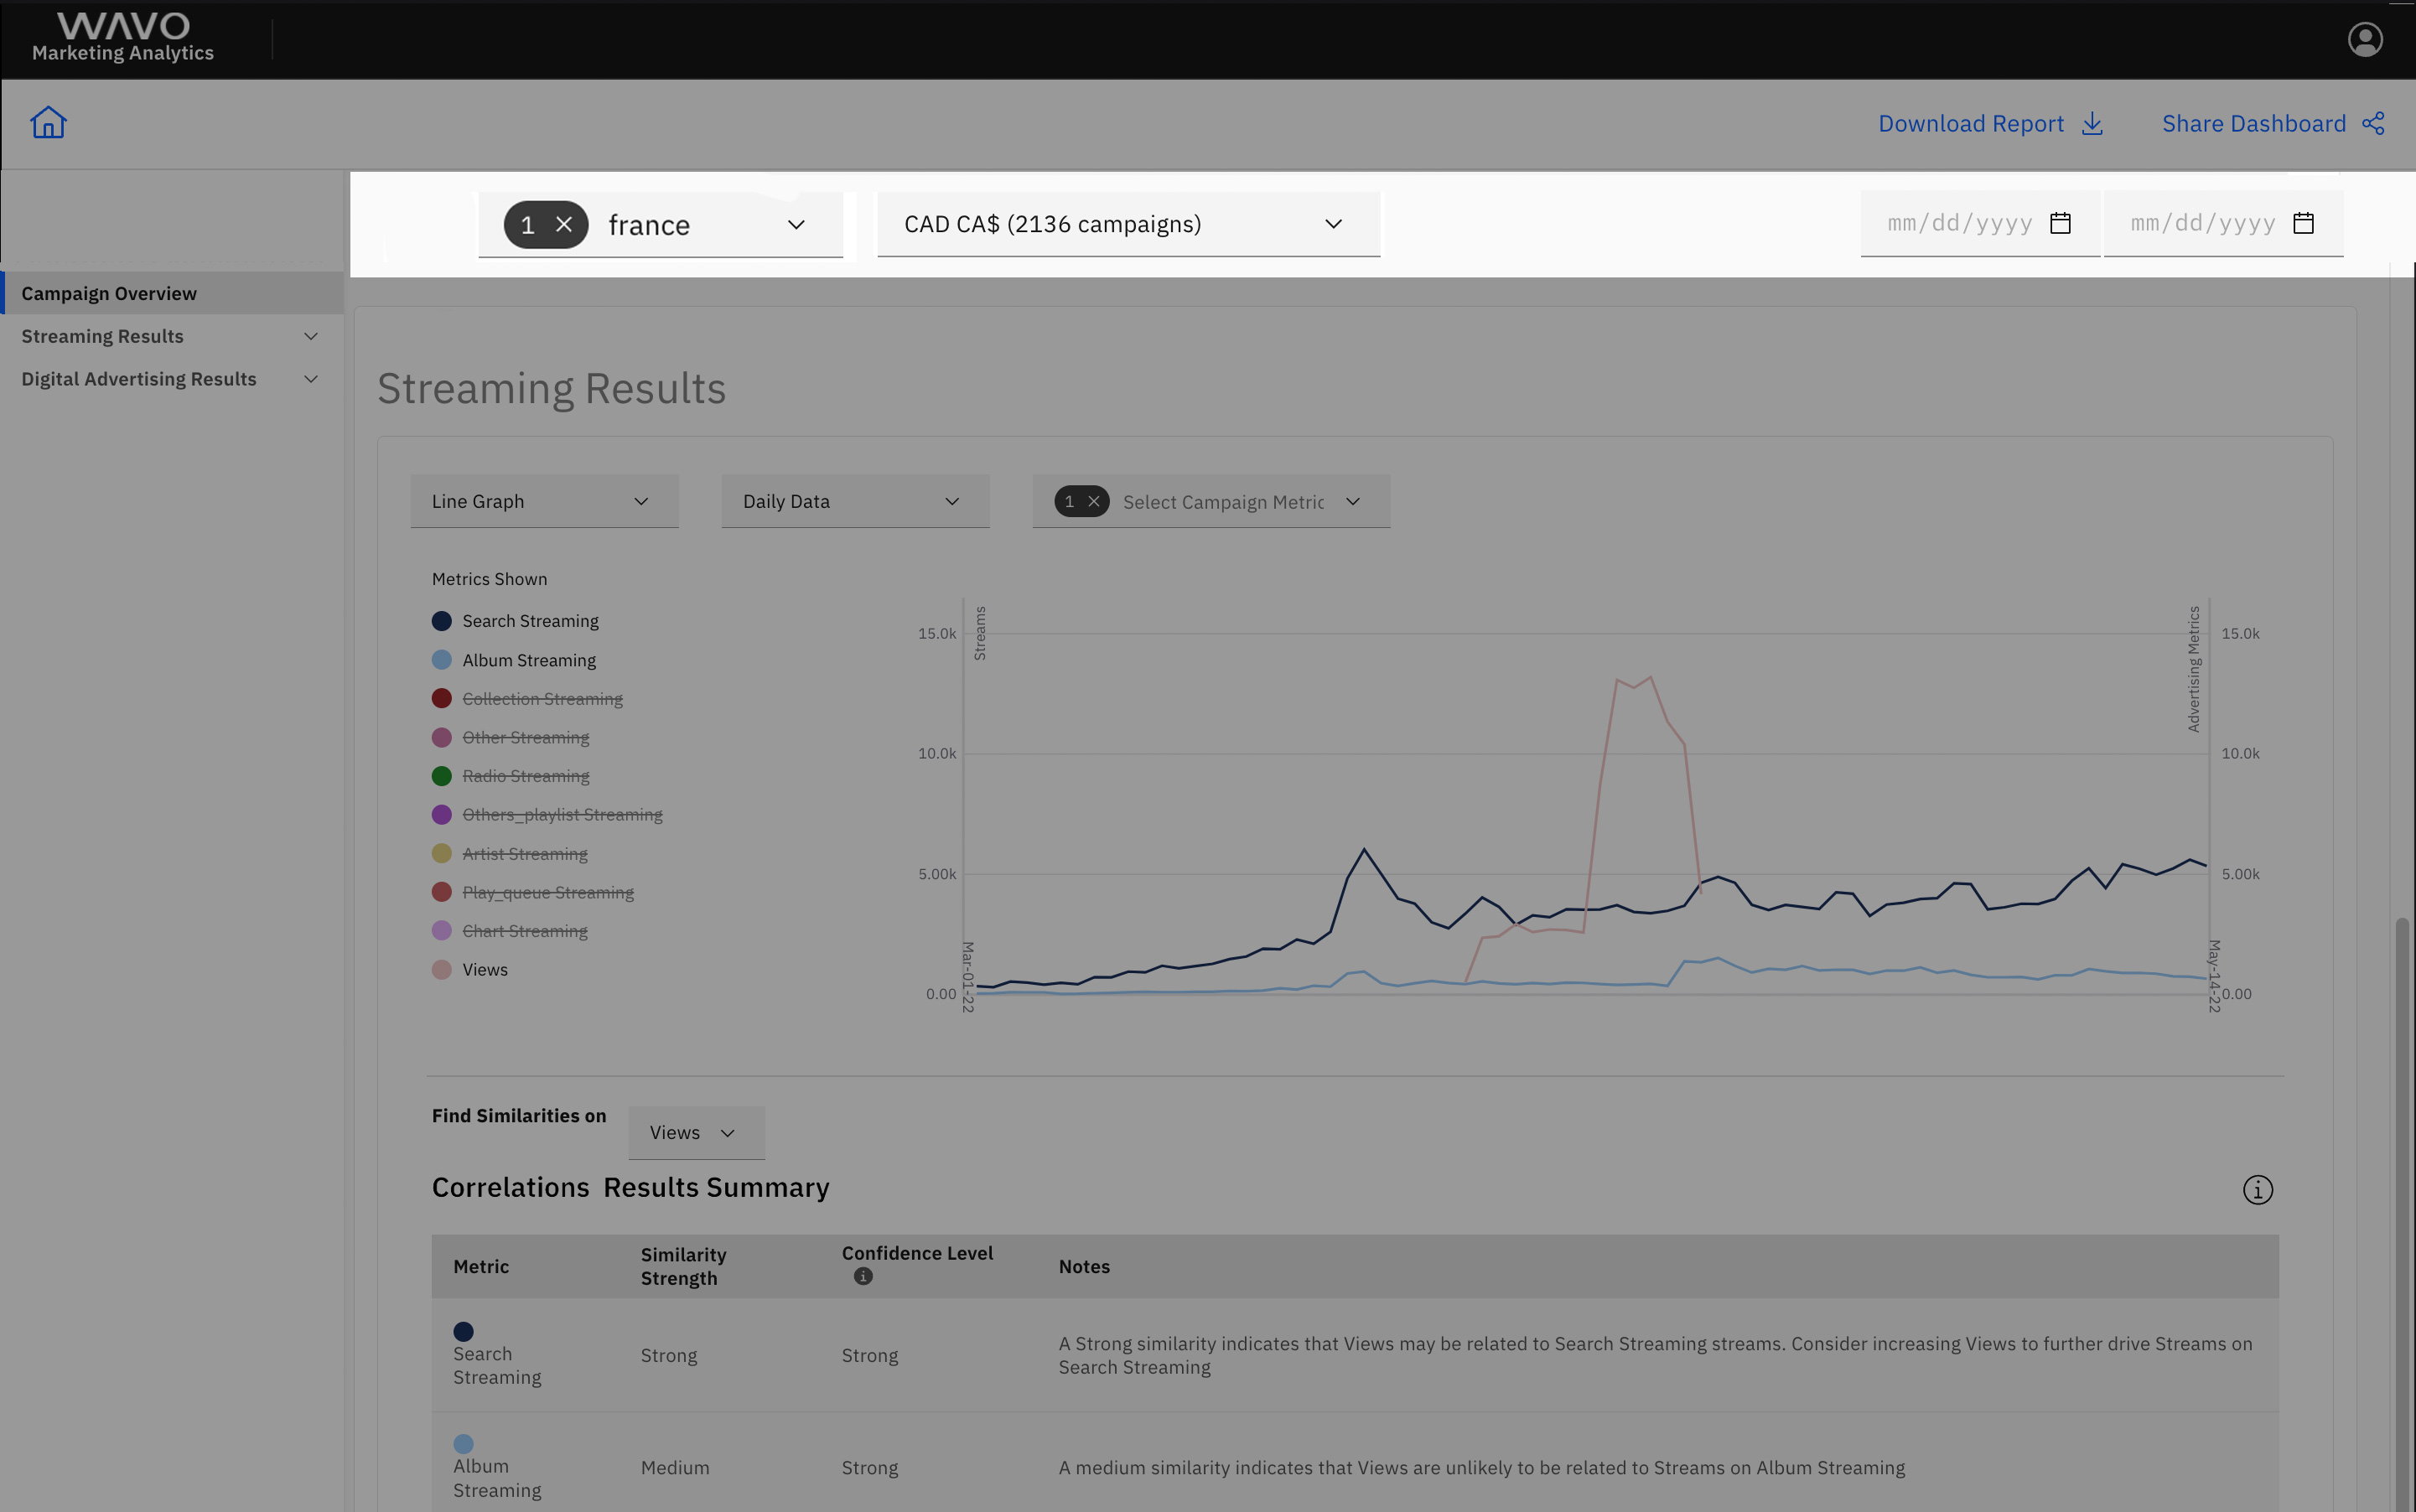
A key aspect of surfacing correlations is to make sure you are looking in the right place; to do so you should filter your streaming data to the specific country you want to find potential links with.
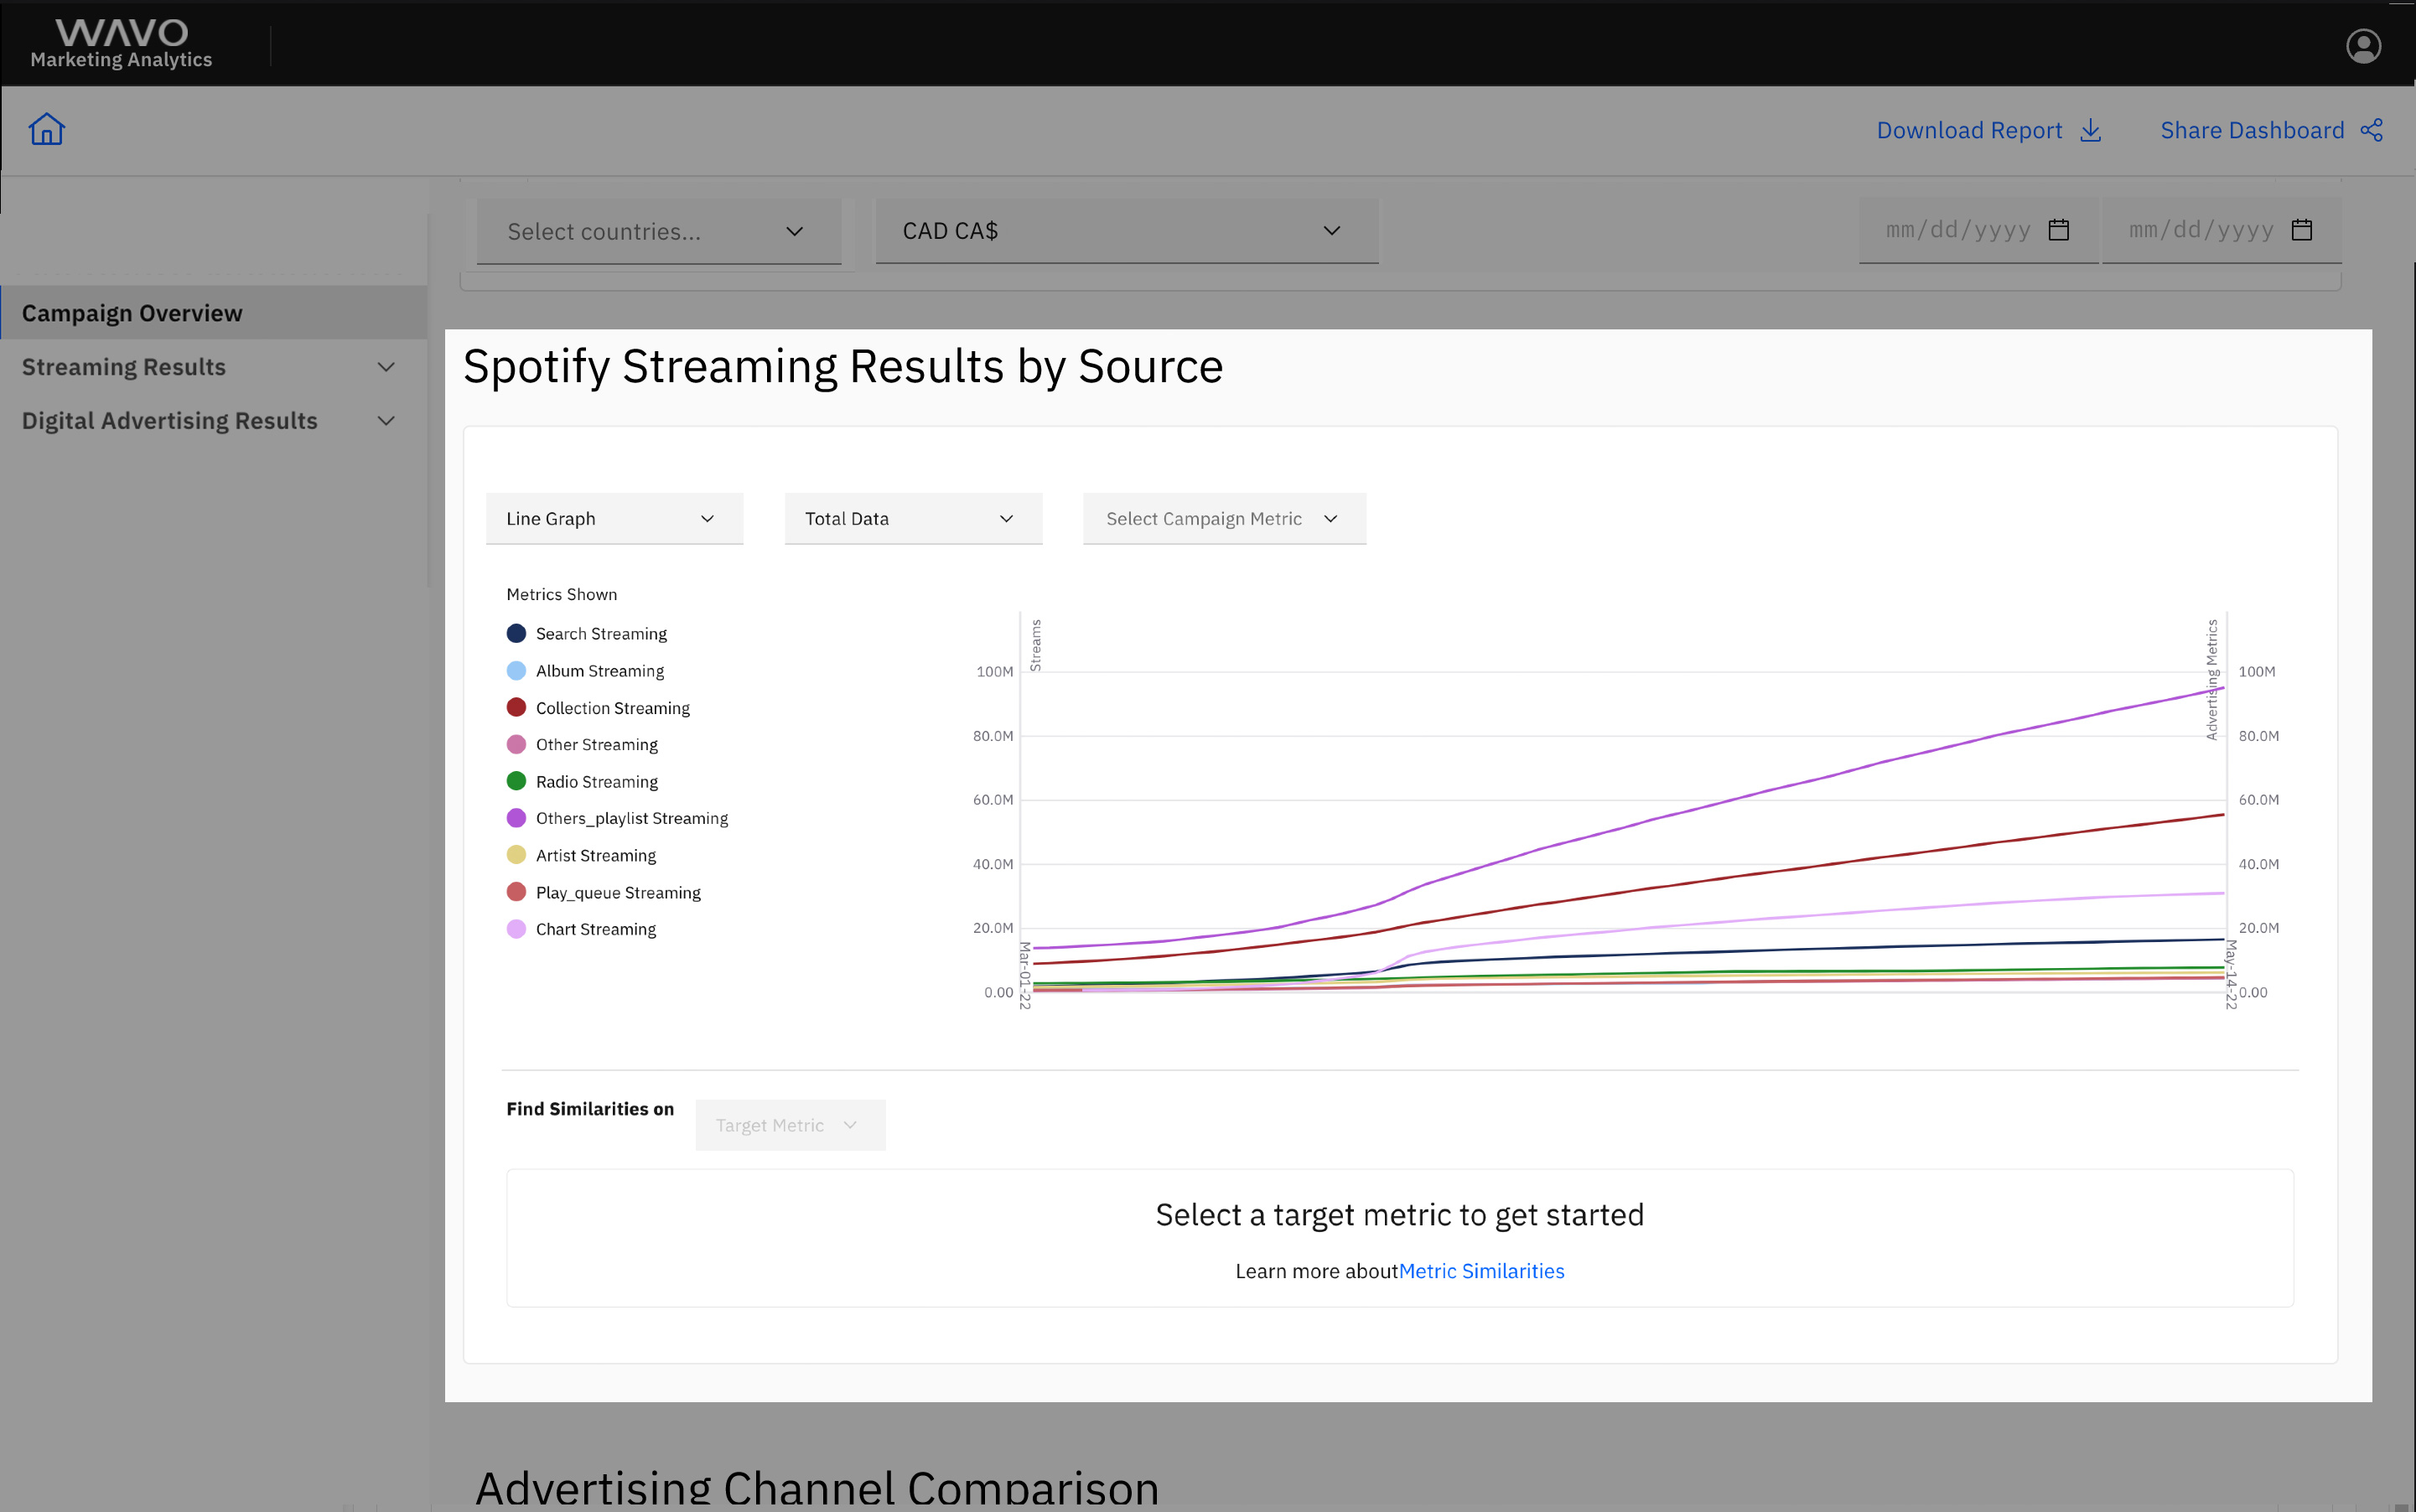
Once you have scoped your streaming results to the country you are advertising in, you are ready to start examining any correlations. A good start is to overlay advertising impressions, as this is the most generic of all advertising metrics.
Once you have overlaid one or more advertising metrics to the streaming results graph, now use the ‘Target Metric’ drop down to select which metric you'd like to calculate correlations for.
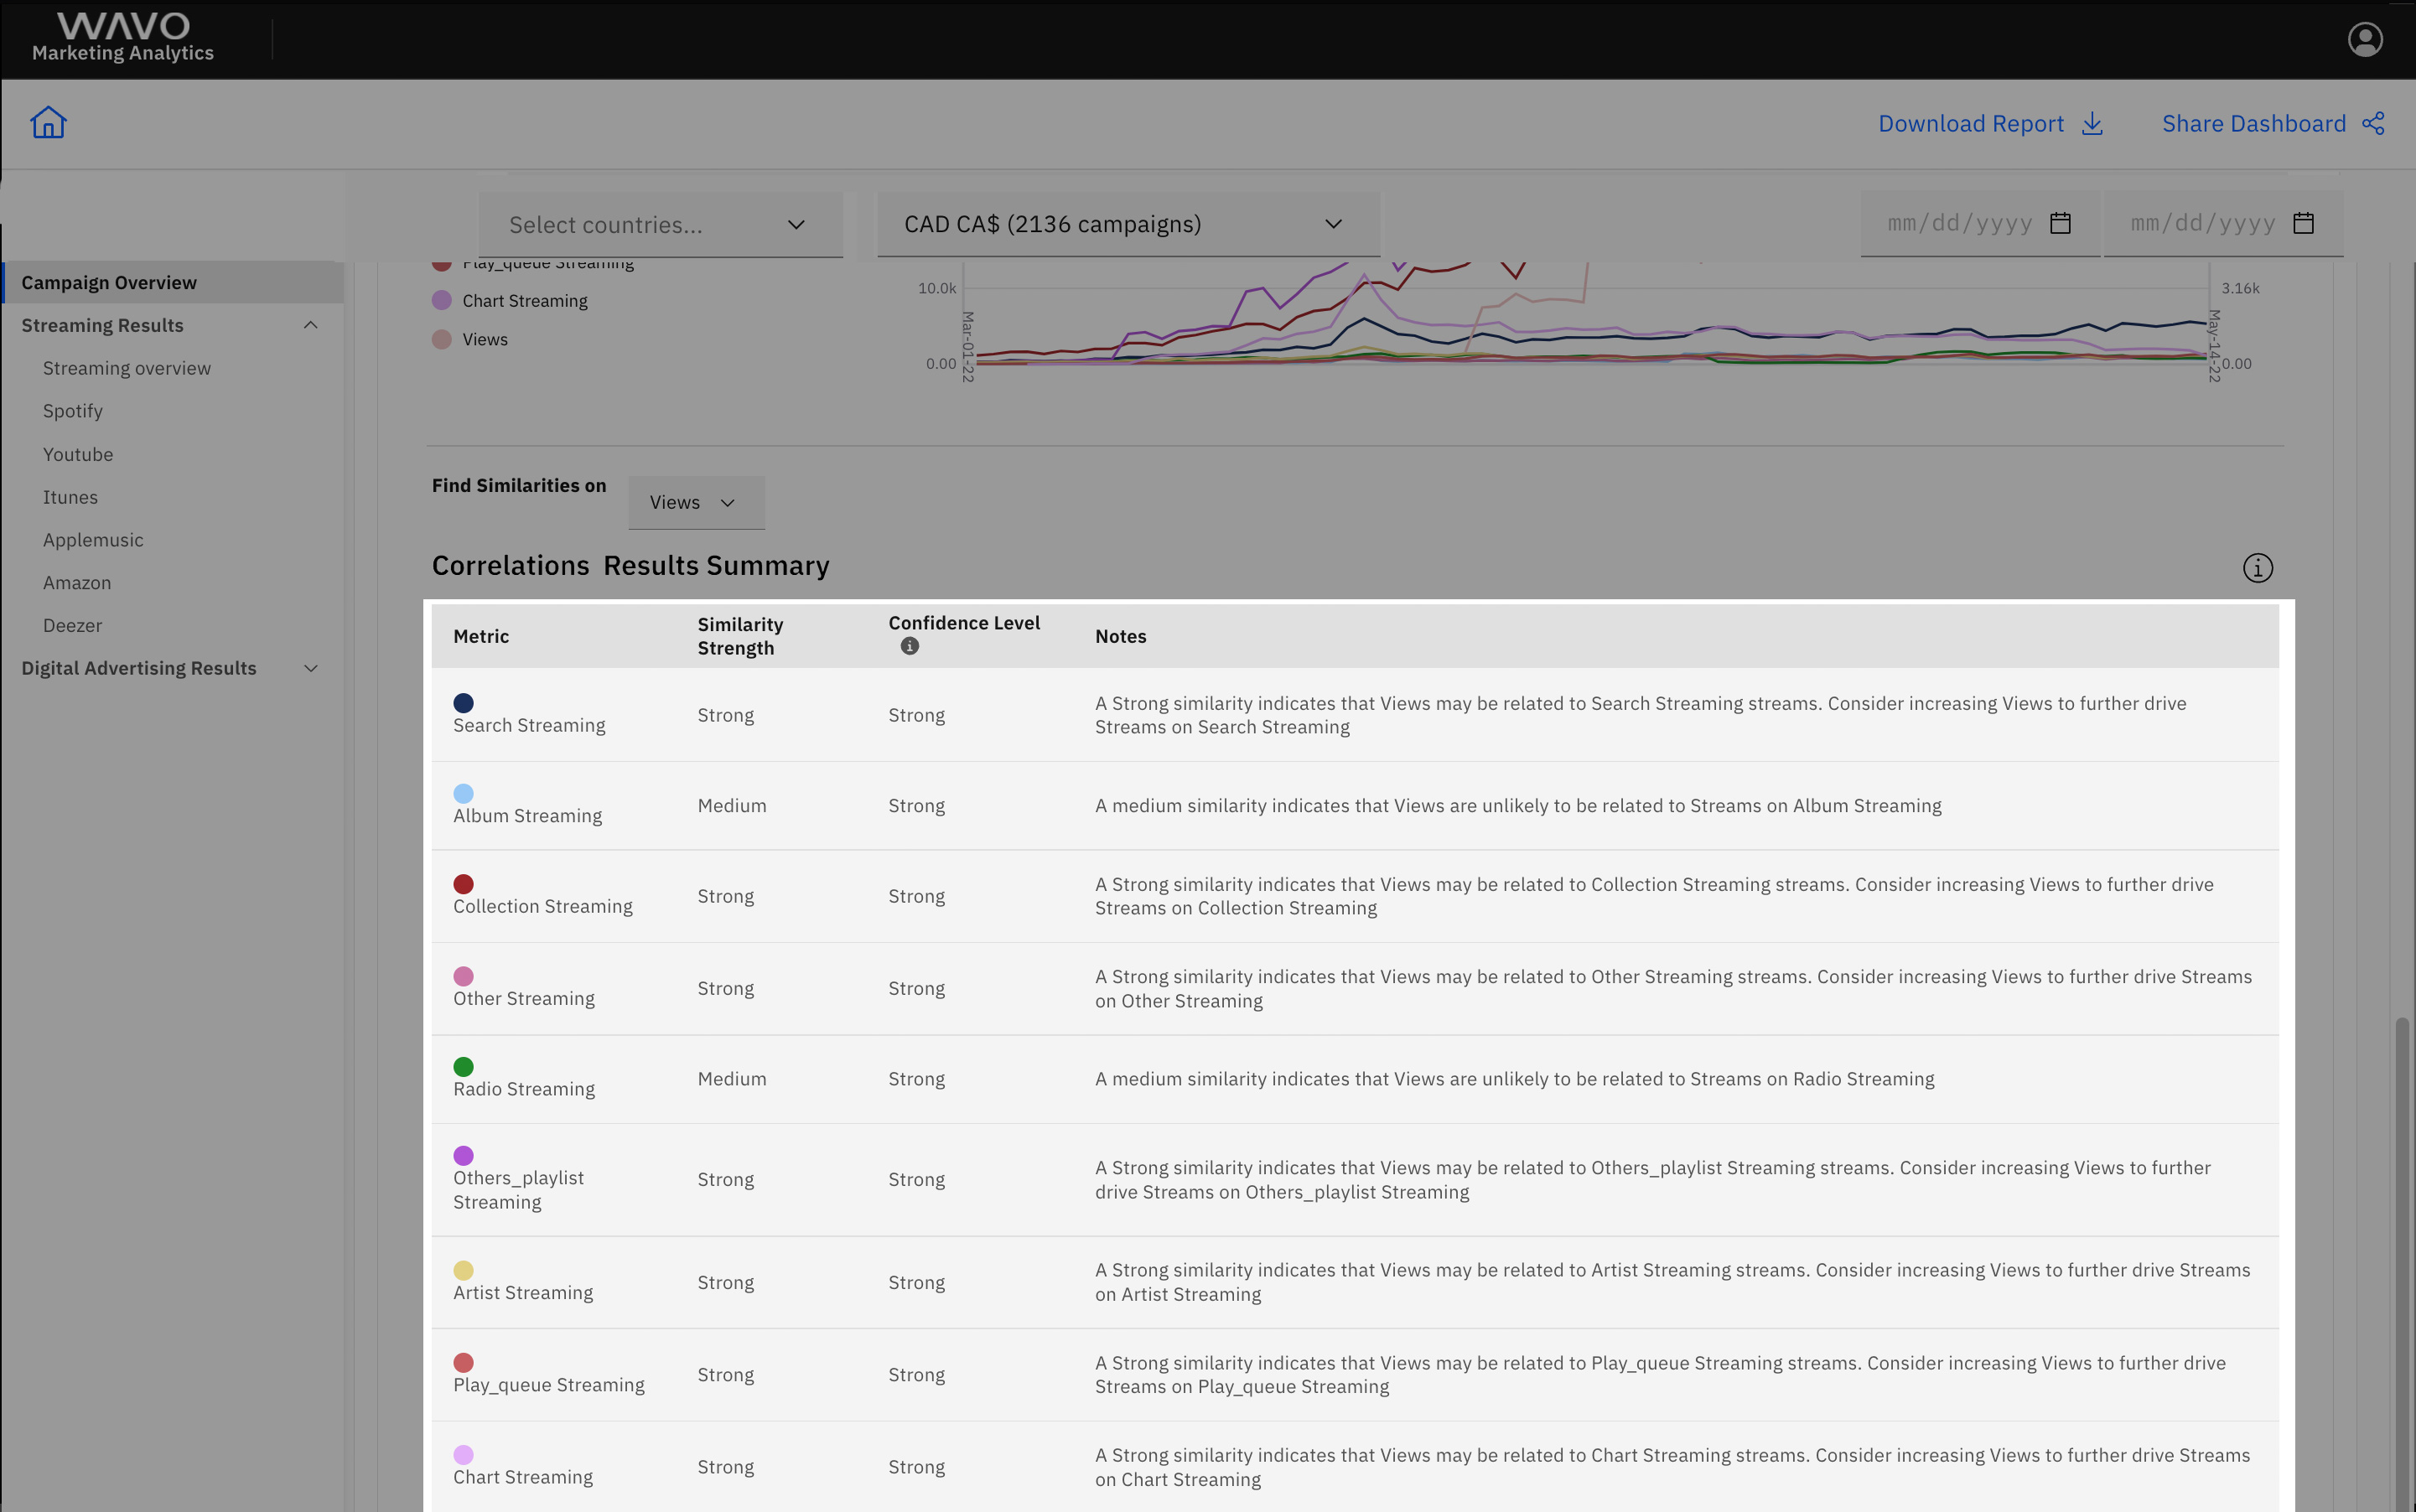
Calculated Correlation results are immediately displayed in the Correlations Summary Results table, and sorted by Similarity Strength. This table is where you can understand how your advertising efforts may relate to streaming results for the release, and also demonstrates the impact your efforts have when it comes to driving streams.
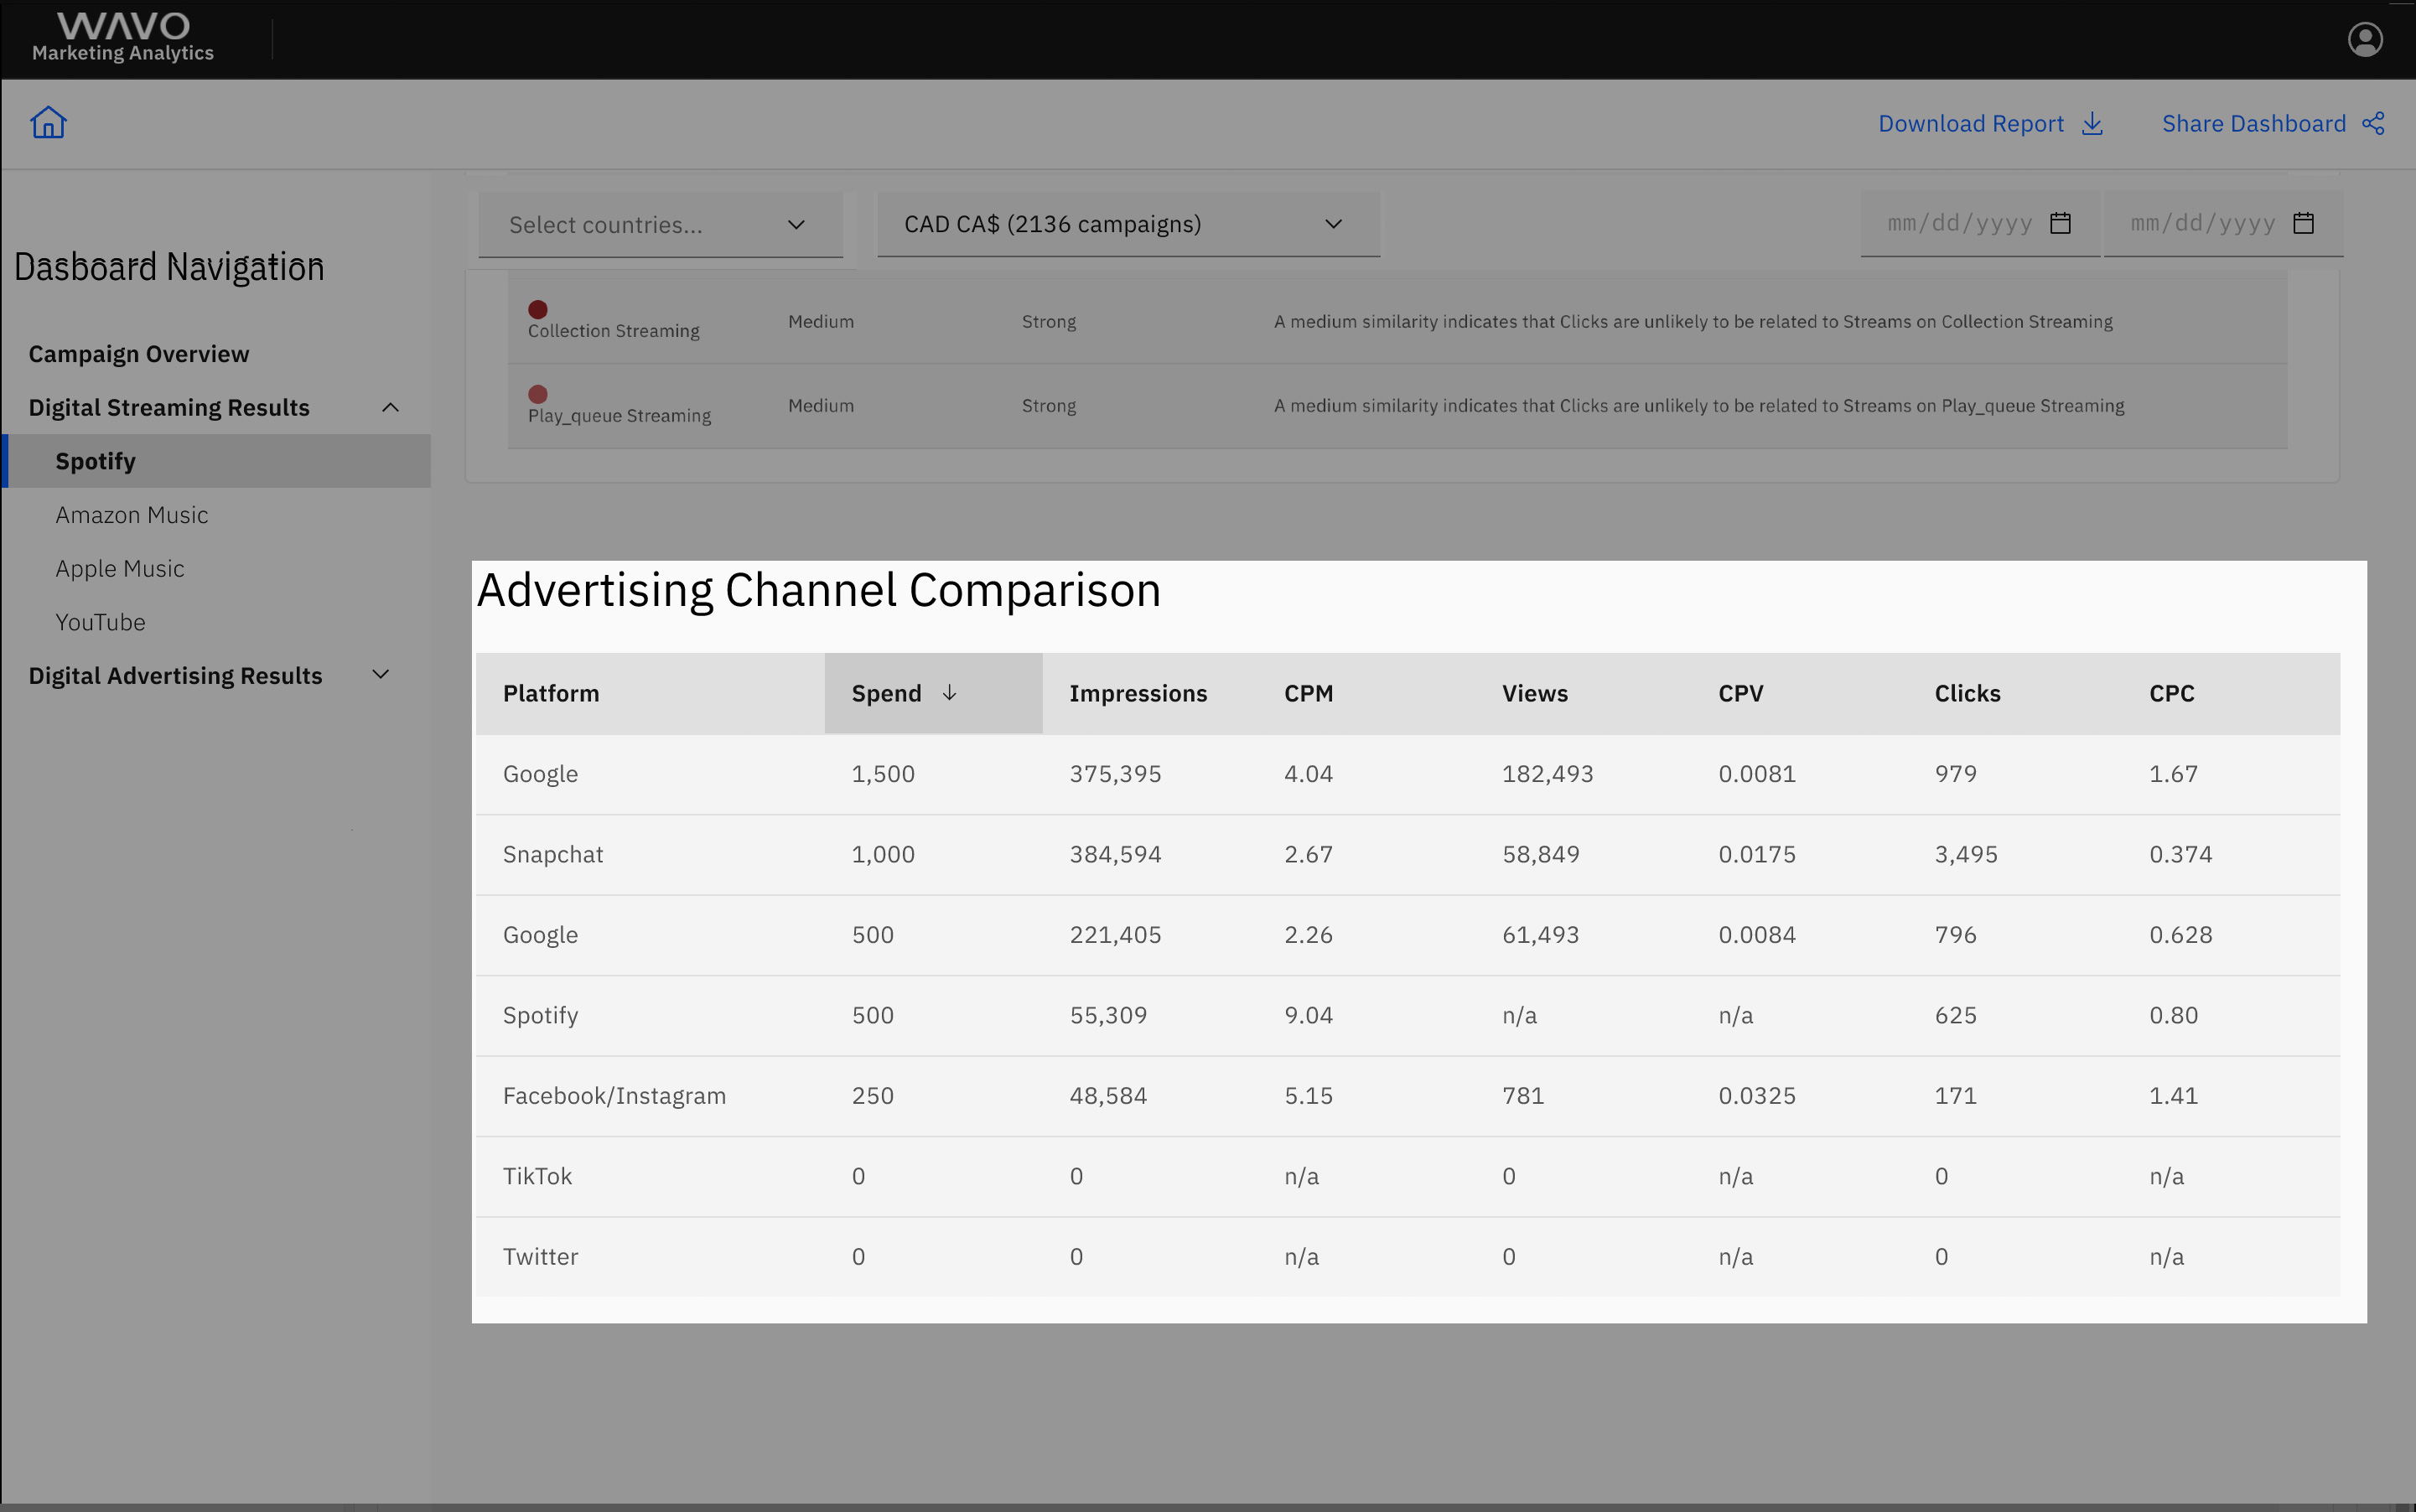
If no correlations are found, this is an indication that your campaigns are having little effect and it may be best to withdraw any remaining advertising budgets from the campaign in question. However, if it is determined that there are correlations between advertising and streaming results, the ‘Advertising Channel Comparison’ table can help you identify which channel is the most cost-effective at driving streams. Once the platform that is driving the most cost-effective marketing results (that also positively correlates with streaming results) is identified, you should look into re-allocating any existing campaign budgets or adding extra advertising budget to this platform.
What value does it provide?
More Informed Marketing Investment Decisions
Streaming Correlations give marketers confidence when questioning whether their digital advertising efforts are effective in driving streaming results for their release, and what streaming segment is seeing the greatest impact. This in turn allows to marketers allocate budgets to platforms and campaigns that are likely to be the most effective.
Saves Time
Streaming Correlations make it quick and easy for marketers to perform complex analyses themselves to understand if there is a link between advertising efforts and streaming results for a release. This immediate analysis allows marketers more time for make campaign optimizations and saves time previously spent trying to manually assess campaign data.
What are some examples of situations where this feature is valuable?
There are numerous situations where the Streaming Correlations widget can be utilized;
Building Awareness for a Release
Streaming Correlations, helps marketers understand if their paid-media investments are driving Streams in specific segments on Spotify. By surfacing correlations between advertising efforts and ‘Search’ Streams on Spotify, marketers can be confident that their advertising efforts are driving listeners to search out the song on Spotify, and are having a demonstrable effect on driving awareness for a release.
Determining What Campaign Or Advertising Channel Is Most Effective
A common use case for the Streaming correlations widget is to help marketers determine what advertising channels are the most cost-effective for a campaign. Once it has been established that a specific marketing result has a strong correlation to driving streams for a release, marketers can use the ‘Advertising Channel Comparison’ Table to understand which platform is the most cost-effective at driving these results. This information can then, in turn, guide marketers to re-allocate or add campaign budgets to this channel to continuously drive streaming results.
Driving Traffic For A Playlist
By surfacing correlations between ‘Others Playlist’ streams on Spotify and advertising results, digital marketers can provide a conclusion that demonstrates that their paid-media investments are having an impact on generating streams from the playlist marketers are driving traffic towards.
Driving Music Video Views For A Release
Using 'Streaming Correlations with YouTube Results' can be a great method for marketers to understand if their marketing efforts are driving music video views for an artist. If a strong correlation is found between advertising and views on YouTube, a digital marketer can capitalize on this opportunity and increase their advertising budget to further drive views for the video release.
Interpreting Results
Each correlation is represented by an individual card in the 'Correlations Summary Results' table. This table will display the streaming segment that was impacted most, the correlation strength to the target advertising metric, confidence in the correlation calculation, and key findings. Results are sorted by correlation strength.
What are the ‘brackets’ for the different Confidence strength values?
The confidence strength listed in the table is a measurement of statistical significance describing how likely it is that your data would have occurred by random chance. A strong correlation provides evidence that there is a statistically significant relationship between your advertising and streaming results, with a resulting p-value of less than 0.05
What are the ‘brackets’ for the different Correlation strength values?
Results for correlations between advertising and streaming results are sorted by the correlation strength between the different streaming segments. Correlations are calculated using a well-known statistical algorithm called the Pearson correlation coefficient.
The Pearson coefficient is a single number between -1 and 1 and it indicates how closely a set of streaming results moves with your target advertising metric. a value of 1 implies that all data points lie on a line for Streaming Results increase as Advertising results increase, and vice versa for −1 A value of 0 implies that there is no linear dependency between the set of results.
A strong correlation is assigned with any Pearson coefficient strength of 0.75 or greater, and a medium correlation is assign for strengths between 0.75 and 0.35. Any value less than 0.35 is denoted as a ‘Weak Correlation’.